Haven't signed into your Scholastic account before?
Teachers, not yet a subscriber?
Subscribers receive access to the website and print magazine.
You are being redirecting to Scholastic's authentication page...
Announcements & Tutorials
NEW! SuperSTEM Coming Fall 2023
Sharing Google Activities
2 min.
Setting Up Student View
Exploring Your Issue
Using Text to Speech
Join Our Facebook Group!
1 min.
Subscriber Only Resources
Access this article and hundreds more like it with a subscription to DynaMath magazine.
SCOTT NEVILLE/AP Images
STANDARDS
CCSS: 3.MD.B.3
TEKS: 3.8A
Article Options
Presentation View
Swimming Ponies
Jim McMahon/Mapman®
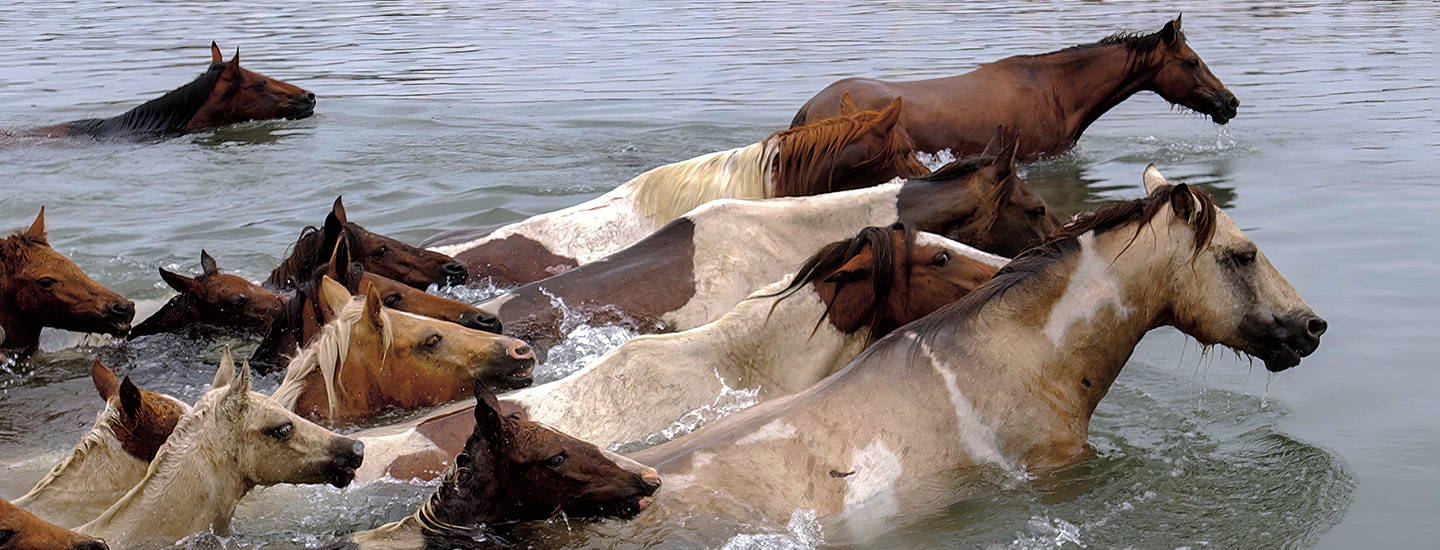
Something special happens off the coast of Northern Virginia every summer. Wild ponies go for a swim between the islands of Chincoteague and Assateague!
The ponies have lived on Assateague Island for more than 400 years. Since the 1920s, the ponies have been herded across a narrow body of water between the two islands each summer.
When they arrive on Chincoteague, the ponies get their annual checkups. Some are auctioned off to new homes. About 35,000 visitors watch the swim and auction from the shore.
The pony auction raises money for Chincoteague’s fire department. It also helps preserve Assateague’s ecosystem. The island is only big enough for a population of about 150 ponies. The line graph on the next page shows how many ponies were auctioned off each year. Why do you think this number changes?
Line graphs are visual displays used to show how data changes over time. Each point on this line graph corresponds to a year on the x-axis and a value on the y-axis.
Number of Ponies Auctioned At Chincoteague By Year
Use the line graph to answer the questions.
How many years of data does this line graph represent?
A. 5 B. 11 C. 2011 D. 2021
In which year was the greatest number of ponies auctioned?
A. 2011B. 2017 C. 2012D. 2021
About how many more ponies were auctioned in 2020 than in 2018?
Do you think the number of ponies auctioned at Chincoteague Island increased or decreased in 2022? Explain.
<p>All the living and nonliving things that interact with one another in a place</p>
<p>Graphs that show change in data over time</p>