Lexington Herald-Leader/MCT Graphics via Getty Images

STANDARDS

CCSS: 3.NF.A.1, 3.NF.A.3.D, 4.MD.A.1, 4.MD.A.2

TEKS: 3.3A, 3.8B, 4.9B, 5.9C

Beyond Bullying

Learn some ways adults and kids stand up to bullying

People aren’t always nice to each other. Sometimes, they can be downright mean. Bullying is when words or actions are used to hurt someone more than once.

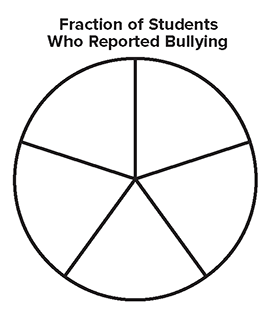
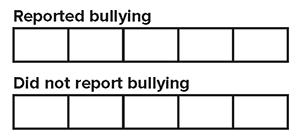
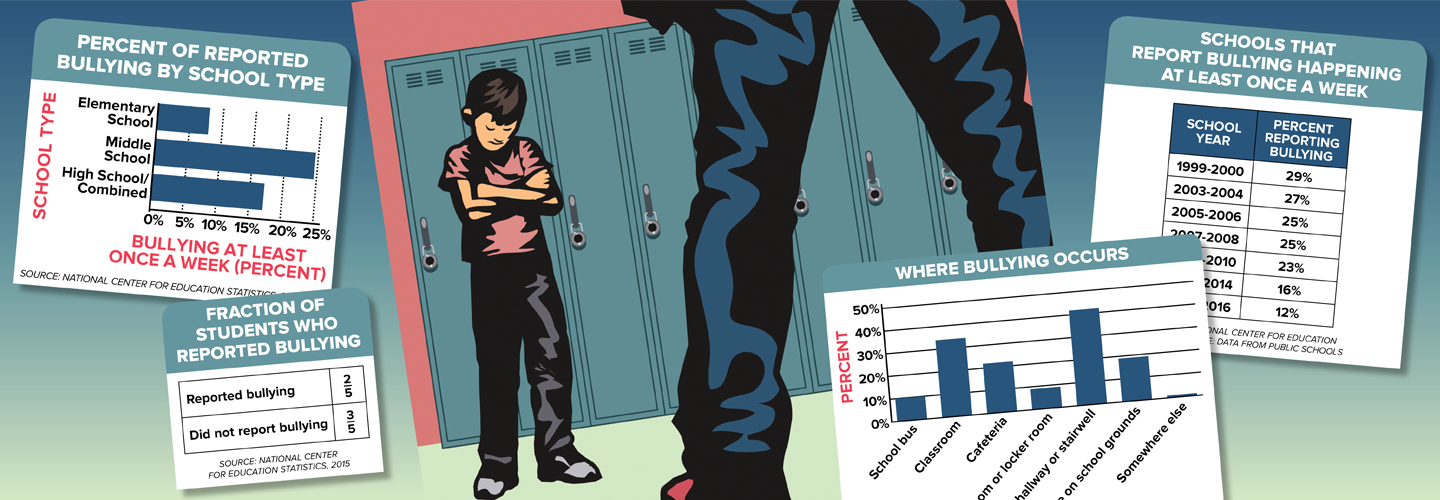
Bullying happens everywhere and to more people than you may think. More than two in five students report being bullied.

The PACER Center in Minnesota has run the National Bullying Prevention Center since 2006. The center teaches students, parents, and schools about the effects of bullying. It also encourages communities to help prevent bullying and promote kindness.

“Bullying is an issue that impacts all kids,” says Bailey Lindgren of PACER. Often kids are bullied for things that make them unique. “Bullying is about power,” she says.

If you see someone being bullied, speak up. Researchers have found that when a peer steps in, more than half of bullying situations stop within 10 seconds.

Spreading kindness can also help. It happened at Marshall Elementary School in Wexford, Pennsylvania. About 20 fourth-graders formed an anti-bullying club about five years ago.

Older students are buddies to younger students, writing letters and reading stories. They also created a buddy bench on the playground. Students can go there if they want someone to play with. Their work won a national award from the PACER Center last May.

“Together we can help create a world without bullying,” says Lindgren.

People aren't always nice to each other. Sometimes, they can be downright mean. Bullying is using words or actions to hurt someone more than once.

Bullying happens everywhere. It happens to more people than you may think. More than two in five students report being bullied.

The PACER Center is in Minnesota. The organization has run the National Bullying Prevention Center since 2006. The center teaches students, parents, and schools about the effects of bullying. It encourages communities to help prevent bullying. And it promotes kindness.

"Bullying is an issue that impacts all kids," says Bailey Lindgren. She works at PACER. Often, kids are bullied for things that make them unique. "Bullying is about power," she says.

If you see someone being bullied, speak up. Researchers have found that when a peer steps in, more than half of bullying situations stop within 10 seconds.

Spreading kindness can also help. It happened at Marshall Elementary School in Wexford, Pennsylvania. About 20 fourth-graders formed an anti-bullying club. This happened about five years ago.

Older students are buddies to younger students. They write letters and read stories. They also created a buddy bench on the playground. Students can go there if they want someone to play with. The older students' work won a national award from the PACER Center. They got the award last May.

"Together we can help create a world without bullying," says Lindgren.

Why can you make a circle graph from the information in the chart “Fraction of Students Who Reported Bullying”?

A. because there are two fractions

B. because the fractions are different parts that make up the same whole

C. because it’s about bullying

D. There is not enough information to answer.

Why can you make a circle graph from the information in the chart “Fraction of Students Who Reported Bullying”?

A. because there are two fractions

B. because the fractions are different parts that make up the same whole

C. because it’s about bullying

D. There is not enough information to answer.

Fill in the circle graph with the fractions from the chart. Use a different color for each fraction and label it.

Fill in the circle graph with the fractions from the chart. Use a different color for each fraction and label it.

Fill in each tape diagram to represent the fractions in the chart. Which is greater?

Fill in each tape diagram to represent the fractions in the chart. Which is greater?

What do you notice about the percentages in the chart “Schools That Report Bullying Happening At Least Once a Week”?

A. They decrease over time.

B. They increase over time.

C. They stay roughly the same.

D. There is not enough information to answer.

What do you notice about the percentages in the chart “Schools That Report Bullying Happening At Least Once a Week”?

A. They decrease over time.

B. They increase over time.

C. They stay roughly the same.

D. There is not enough information to answer.

Where does most bullying occur?

A. in the hallway or stairwell

B. on the school bus

C. in the cafeteria

D. inside the classroom

Where does most bullying occur?

A. in the hallway or stairwell

B. on the school bus

C. in the cafeteria

D. inside the classroom

What is different about the two bar graphs?

What is different about the two bar graphs?

According to the graphs, does bullying happen more often to elementary students or middle school students? How do you know?

According to the graphs, does bullying happen more often to elementary students or middle school students? How do you know?

A student wants to find out how much bullying occurs in her school. What are some ways she can collect this data? Choose all that apply.

A. She can talk to students at the school about bullying.

B. She can talk to teachers at the school about bullying.

C. She can survey students at the school about bullying.

D. She can watch a TV program about bullying.

A student wants to find out how much bullying occurs in her school. What are some ways she can collect this data? Choose all that apply.

A. She can talk to students at the school about bullying.

B. She can talk to teachers at the school about bullying.

C. She can survey students at the school about bullying.

D. She can watch a TV program about bullying.

promote

To help with the growth or development of something

bar graphs

Graphs that uses bars to compare data

data

Facts or information used to make or calculate a value

tape diagram

A visual model that represents a relationship between two or more quantities

circle graph

Used to compare different portions or percentages of a whole; the greater the angle measure of each “slice” of the circle, the greater the portion

unique

The only one if its kind; unlike anyone or anything else

percentages

Parts of a whole expressed in hundredths

Example: 62 percent (also written as 62%) means 62 parts out of 100

Fraction

A number that stands for part of a whole. Fractions are typically written in the form “1/8” (“one-eighth”)

Example: If an apple is cut into 4 equal slices, and you eat one slice, you have eaten ¼ of an apple

communities

Places and the people or organisms who live there

Google Quiz

Click the Google Quiz button below to share an interactive version of the questions with your class. Click Download PDF for the non-interactive blank Answer Sheet.

Download PDF
Skills Sheets (1)
Lesson Plan (1)
Text-to-Speech