
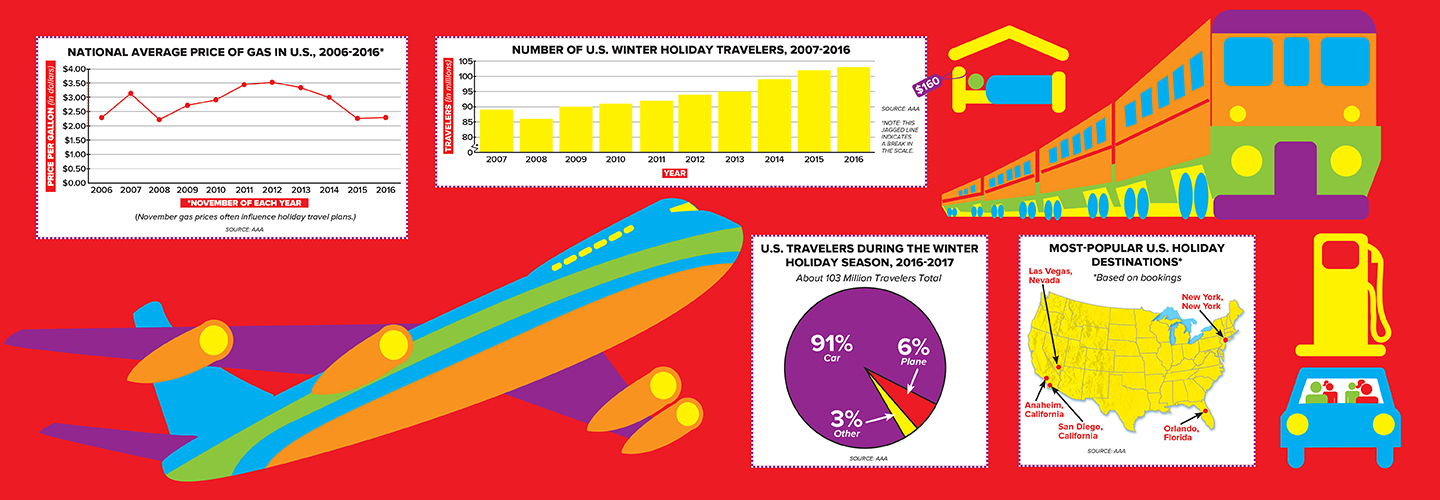
A lot of people will be hitting the road this holiday season. Last year, a record number of Americans traveled for the winter holidays—103 million!
Driving is by far the most popular way to travel during the holiday season. But plenty of people will be flying, taking a train, or riding on a bus. Last year, the three busiest airports during the holidays were Atlanta’s Hartsfield-Jackson, LAX in Los Angeles, and Chicago’s O’Hare. Now check out these charts and graphs to find out more about holiday travel in the U.S.